Last Name:
First Name:
Advanced Search
Surnames
What's New
Most Wanted
Photos
Histories
Documents
Albums
All Media
Cemeteries
Headstones
Places
Notes
Dates and Anniversaries
Reports
Sources
Bookmarks
Contact Us
Find
Surnames
First Names
Search People
Search Families
Search Site
Places
Dates
Calendar
Cemeteries
Bookmarks
Media
Photos
Documents
Headstones
Histories
Recordings
Videos
All Media
Info
What's New
Most Wanted
Reports
Statistics
Trees
Branches
Notes
Sources
Repositories
DNA Tests
Contact Us
Home
Search
Search
|
Advanced Search
|
Search Families
|
Search Site
First Name:
Last Name:
ID:
Share
Print
Bookmark
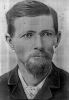
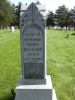
John GRAHAM
1817 - 1867 (50 years)
Individual
Ancestors
Descendants
Relationship
Timeline
Family
Suggest
Generations:
1
2
3
4
Standard
|
Compact
|
Vertical
|
Text
|
Register
|
Tables
|
PDF
Drag or scroll to see more of the chart.
Mary J. GRAHAM
1838-
Mary J. GRAHAM
B:
abt. 1838
Kentucky
James M. GRAHAM
Abt 1840-
James M. GRAHAM
B:
Abt 1840
Kentucky
Irena GRAHAM
1842-
Irena GRAHAM
B:
abt. 1842
Kentucky
Elijah GRAHAM
1844-
Elijah GRAHAM
B:
abt. 1844
Kentucky
Alice GRAHAM
1846-
Alice GRAHAM
B:
abt. 1846
Kentucky
William Taylor GRAHAM
1846-1891
William Taylor GRAHAM
B:
14 Sep 1846
Gallatin County, Kentucky
D:
17 Feb 1891
Adams County, Nebraska
Indiana Melissa SLAWSON
1850-1924
Indiana Melissa SLAWSON
B:
8 Nov 1850
Switzerland County, Indiana
M:
1866
Switzerland County, Indiana
D:
14 Jul 1924
Hastings, Adams Co., Nebraska
Margaret A. GRAHAM
Abt 1849-
Margaret A. GRAHAM
B:
Abt 1849
Kentucky
John H. GRAHAM
Abt 1851-
John H. GRAHAM
B:
Abt 1851
Kentucky
Nancy ?
Abt 1854-
Nancy ?
B:
Abt 1854
Indiana
Oliver GRAHAM
Abt 1859-
Oliver GRAHAM
B:
Abt 1859
Indiana
John GRAHAM
1817-1867
John GRAHAM
B:
abt. 1817
Kentucky
D:
19 Apr 1867
Indiana
Lucinda CROUCH
1818-1860
Lucinda CROUCH
B:
1818
Tennessee
M:
5 Aug 1837
Gallatin, Kentucky
D:
Between 1859-1860
Indiana
Clifford Clayton GRAHAM
1861-1948
Clifford Clayton GRAHAM
B:
30 Nov 1861
Switzerland County, Indiana
D:
3 Nov 1948
Glenwood Springs, Garfield Co., Colorado
Carrie S. HITZFIELD
1867-1925
Carrie S. HITZFIELD
B:
Apr 1867
Indiana
M:
27 Mar 1888
Hastings, Adams Co., Nebraska
D:
1925
Colorado
Ida Mae GRAHAM
1864-1956
Ida Mae GRAHAM
B:
5 Oct 1864
Switzerland County, Indiana
D:
15 Nov 1956
Los Angeles, Los Angeles County, California
James ARCHER
1863-1924
James ARCHER
B:
27 Feb 1863
Pennsylvania
M:
1886
D:
14 Jul 1924
Hanover, Jefferson Co., Indiana
Angeline MANSER
1821-1897
Angeline MANSER
B:
20 Oct 1821
Allensville, Switzerland Co., Indiana
M:
3 Mar 1861
Indiana
D:
24 Jan 1897
Switzerland County, Indiana


 This site powered by The Next Generation of Genealogy Sitebuilding ©, written by Darrin Lythgoe 2001-2024.
This site powered by The Next Generation of Genealogy Sitebuilding ©, written by Darrin Lythgoe 2001-2024.
This site powered by The Next Generation of Genealogy Sitebuilding ©, written by Darrin Lythgoe 2001-2024.